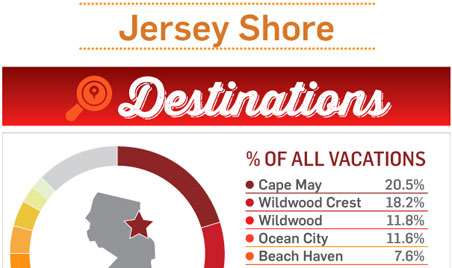
Is Cape May Really the Most Popular Shore Town?
Rental real estate listing site FlipKey.com has just published infographics for 25 common vacation destinations, and the Jersey Shore is one of them. It’s a nice try at quantifying the habitats and habits of visitors to Shore, but I say take it with a huge grain of salt. Maybe the entire shaker.
FlipKey’s data was taken from 35,000 reservation requests made through its site — which allows individual property owners and property managers to list their homes, condos and apartments for rent — over the last three years. And there lies the biggest problem: If a property hasn’t been listed on FlipKey, it wasn’t included in the calculations. Hotels and motels are left out entirely — and that’s a huge part of the hospitality market up and down the coast. The Borgata in Atlantic City alone has more than 2,700 rooms that just aren’t in the equation.
It turns out that the number of local real estate agencies that have signed up with FlipKey has a big sway on how a town looks in the survey. This is why a place like chart-topping Cape May — which I love, and is of course an extremely popular destination — might look even more popular than it actually is. I found two Cape May agencies listing their properties through Flipkey — one with 291 listings and the other with 173. Exceptionally popular Asbury Park, on the other hand, has no agency listings (and only eight owner listings) — and isn’t mentioned once on the FlipKey infographic.
This narrow data set also means that statements like “there are almost no visits from Columbus Day through Memorial Day” are based only on Flipkey properties and not reality, since it doesn’t take into account the enormous hotel and motel market. Is the Shore less crowded in the off seasons? Of course. But the numbers don’t go to “almost no visits” after Columbus Day. Some places, like Cape May (again), see a big spike in business at Christmas, and their robust wedding industry keeps the town busy all fall.
Not all is lost, though. The data do point to some real trends, such the busiest times for shore rentals being the last two weeks of July and the first two weeks of August. After that period, even though summer is far from over, the crowds start to drop (college-age children return to campus; kids start getting ready for school and fall sports). And if you’re looking for a bargain, June and September rentals cost 20 to 30 percent less than at the peak of the high season.
I took my concerns to Eric Horndahl, vice president of marketing for FlipKey, who told me: “I think certain things could skew the results in terms of how much what our inventory looks like in particular area. But I think this is a realistic view in terms of people who are coming to FlipKey.”
And that’s the key point here: This is FlipKey data, not all encompassing tourism data. The infographic presents itself as a snapshot of the Jersey Shore, and it’s just not — Horndahl suggested the numbers would be helpful to people like me who write about the market, and I can’t see that as being true since it leaves so much out.
I take the same kind of issue with the annual New Jersey Sea Grant Consortium “New Jersey’s Top 10 Beaches” contest, which considers things like “environmental criteria” but relies in huge part on citizen voting. In 2008, the first year of the competition, the towns of the Wildwoods were considered separately, but by 2010, they banded together and, with the help of a huge marketing campaign, won that year and again in 2011 and 2012. (The contest was not held for 2013 because of Hurricane Sandy.) Does that make it the best beach in New Jersey? Not necessarily. It doesn’t include all the data, just like the FlipKey survey.
This infographic is an interesting bit of information from one site that handles rentals, and nothing more. It should not be called “Jersey Shore Travel Insights.” It should be called “FlipKey Jersey Shore Listing Travel Insights.”


